How to Analyze Phase Distortion in a Transmission Line

The primary goal in signal integrity is to ensure a signal sent from a driver component in a PCB arrives at the receiver component with minimal differences between the two signals. The signal at the receiver will never perfectly match the signal sent from the driver, but if you try you can usually get close. In extremely high-speed serial protocols, as long as distortion is minimal, the receiver can easily recover the signal through equalization.
When we think of signal distortion, it’s tempting to default to nonlinear distortion, such as harmonic distortion as caused by an amplifier. However, linear channels also create distortion, even though clipping does not occur. So where does this linear distortion come from? One form that is often sometimes overlooked is phase distortion in a transmission line, which modifies the time-domain waveform seen at the receiver. So how can designers account for this form of distortion on a transmission line? Read more to learn about this aspect of signal distortion and why it matters for high speed signals on a PCB.
What is Phase Distortion in a Transmission Line?
Phase distortion is just one form of signal distortion that can occur in a transmission line on a PCB. Phase distortion results when different frequencies travel at different signal velocities due to dielectric dispersion in the PCB substrate. Because the dielectric constant varies with frequency, the signal velocity also varies with frequency. As a result, different frequency components in a real transmission line travel with different velocities.
Phase Velocity
This variation in signal velocity with frequency is quantified using the phase velocity. In short, phase velocity is defined in terms of the angular frequency and the propagation constant on an interconnect:

The term “phase velocity” is not normally discussed among digital designers, but it is vitally important for waveguide designers and RF designers in general. When the phase velocity is a constant (meaning not a function of frequency), all frequency components that make up the Fourier spectrum of an arbitrary digital signal will travel at the same velocity. When the phase velocity is a function of frequency, there will always be phase distortion. In real transmission lines, this is always the case, it’s simply a matter of extent and whether the various sources of distortion will create major signal integrity problems on a transmission line.
Other Distortion Sources
Note that, in the above discussion, I’ve only mentioned phase distortion in a transmission line due to dielectric dispersion. There is also the following sources of distortion:
- Geometric dispersion: This occurs in a real transmission line due to the shape of the transmission line and the boundary conditions imposed on the wave equation for the transmission line.
- Modal distortion in waveguides: All waveguides have specific eigenmodes, which will cause the propagation constant for propagating modes to be a square-root function of frequency just above a mode’s cutoff frequency.
- Attenuation distortion: Even in low-loss laminates, the propagation constant for a transmission line will be a complex number. Both the real and imaginary parts are functions of frequency.
- Copper roughness: On real PCBs, there is always some copper roughness on a real transmission line. Copper roughness is also a source of dispersion due to the skin effect and causality.
- Fiber weave effects: This is still an active area of research (including by me) due to the pseudo-random nature of fiber weave geometries. The approximately periodic nature of the fiber weave in real PCB laminates can modify dispersion in all the areas listed above.
- Impedance matching and line length: Believe it or not, impedance matching and the line length affect the distortion on a transmission line. This is because, even with resistive impedance matching, the load impedance of the receiver component is reactive due to the component’s input capacitance.
All these effects combine to produce some total amount of dispersion in the transmission line, and they all contribute to phase distortion. The exception is attenuation distortion, which only causes attenuation at different frequencies: the different frequency components will travel at the same speed, but they will have different levels of attenuation during travel. There is one factor that nicely summarizes all this behavior on a transmission line (and it’s not S-parameters!): the transmission line’s transfer function.
Phase Matters in a Transmission Line Transfer Function
The phase of a transfer function is important as it is your clue there will be some phase distortion in a circuit, including in a transmission line. In short, if the phase of the line’s transfer function is a purely linear function of frequency, then there will not be any phase distortion. However, there may still be attenuation distortion.
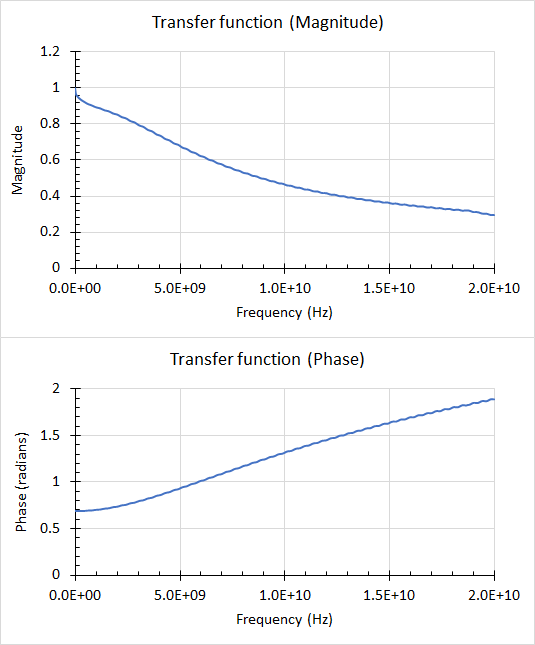
To see this more clearly, let’s look at an example using real data from a stripline. The graphs below show the transfer function (magnitude and phase) of a 25 cm stripline with source and load impedance matching to 50 Ohms on a 2106 PCB laminate. The receiver has input capacitance of 1 pF (this is a bit high for some high speed components but it’s a good example). This transfer function uses the causal correction factor derived in Zhang et al. (2009).

From the magnitude graph, we can immediately see that the transmission line acts like a low-pass filter, just as one would expect! However, here we see that the phase of the transfer function is nonlinear, so we know there will be phase distortion.
Example with a Bandlimited Signal
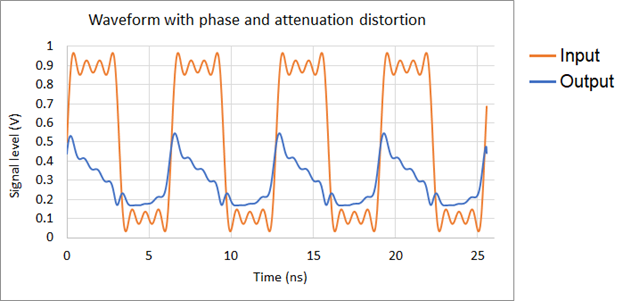
To see this clearly, I’ve used a 7th order approximation for an input bitstream of 1 V digital pulses. Essentially, the bandwidth of the input signal is limited to ~2 GHz, which would require at least 4 GHz bandwidth in the receiver to recover the signal. By using the transfer function and calculating an inverse Fourier transform, we can compare the waveform seen at the receiver with the waveform initially injected onto the transmission line:

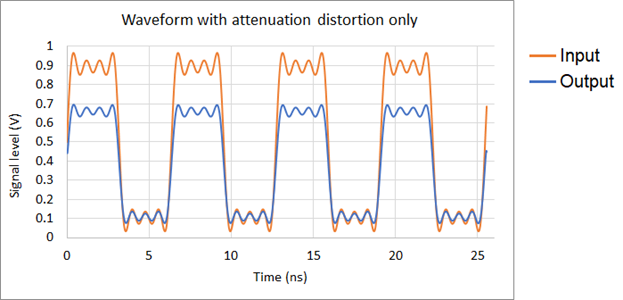
Is this result normal? It’s quite clear that, when the transfer function has a nonlinear phase, there is significant phase distortion on the transmission line. Just to compare, let’s look at the same line, but with phase velocity dispersion set to zero by setting the phase of the transfer function to zero. The graph below shows the output signal calculated with the same procedure:

Wow! It’s clear that a flat phase makes a huge difference! We can see that the signal at the receiver is significantly attenuated as we would expect, but the output waveform very closely matches the shape of the input waveform. The higher frequency components are attenuated as one would expect, but it is clear that our 2 GHz bandlimited signal is still largely preserved and has minimal distortion.
If you’re familiar with transmission line theory, then you know that the Heaviside condition can be used to determine a transmission line design with minimized distortion. Unfortunately, in the presence of broadband dispersion from multiple sources, trying to design to the Heaviside condition throughout the relevant signal bandwidth is infeasible, especially as modern high speed serial protocols have bandwidths spanning many dozens of GHz. I’ll continue discussions about this aspect of broadband interconnect design in future articles, but for now it’s important to have tools to help you experiment with different transmission line designs as you attempt to get to minimum distortion and minimum impedance deviation within some prescribed tolerance.
If you’re a PCB designer, you don’t need to perform phase distortion calculations manually, you just need to use the right set of PCB routing and simulation tools. The routing engine in Altium Designer® includes an integrated electromagnetic field solver from Simberian, which accounts for broadband signal behavior and can help you design transmission lines with minimal impedance deviations on standard PCB laminate materials and weaves. You can also use the integrated pre-layout and post-layout simulation tools to extract a transfer function and determine phase distortion in a transmission line.
When you’ve finished your design, and you want to share your project, the Altium 365™ platform makes it easy to collaborate with other designers. We have only scratched the surface of what is possible to do with Altium Designer on Altium 365. You can check the product page for a more in-depth feature description or one of the On-Demand Webinars.
